Policy Brief: Digital Ballot Images’ Role in Tabulating and Verifying Results
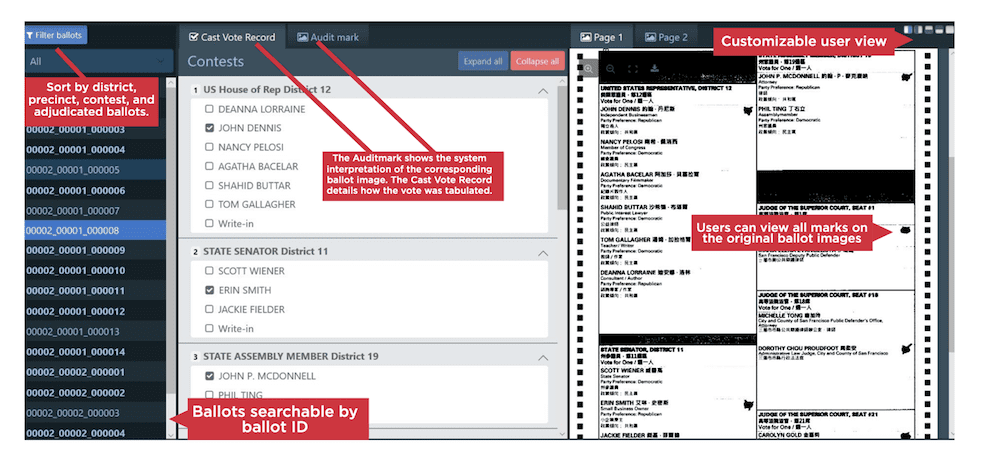
(Dominion’s software comparing votes cast and ballot image. Source: DominionVoting.com)
(This policy paper was based on research of election disinformation and transparency trends. This information will be cited in a late fall 2023 Washington Monthly magazine article .)
Executive Summary
Digital ballot images are one data set among essential records used by election officials and election computer systems to tabulate and verify votes. While most Americans now vote on hand- marked or machine-marked paper ballots, the tabulation process in most jurisdictions is electronic. That process starts with a scanner creating a screenshot of every side of every paper ballot card, which is called a digital ballot image. Both computer software and human election workers analyze and examine ballot images to determine voter intent and to tally votes.
Ballot images have been used across the U.S. by county and state elections officials in recent years in a number of ways. They help to find and fix tabulation errors before the election results are certified, such as a scanner pulling two ballot cards through at the same time. They are used in comprehensive official and unofficial audits before certification, including sharing them with campaigns to determine if recounts and election challenges will be fruitful. Ballot images have been posted online as evidence for the public. Democrats and Republican officials have used ballot images this way in Maryland, Florida, California, Colorado, and other states.
As useful as ballot images may be, they are insufficient to verify results. Ballot images must be compared with other key data for consistency across the tabulation process. Ballot images are the starting line of the electronic tabulation process. The finish line is a large electronic database file of every vote cast on every ballot called the cast vote record (CVR). The CVR is annotated when election workers determine a voter’s intent on a sloppily marked ballot or if other issues arise, such as remaking a spoiled ballot. If necessary, the actual physical ballot can be examined by election boards for further evaluation of tabulation accuracy.
Part I: How Tabulation Systems Work
The technology used in elections consists of several stages and subsystems. Voter registration records and voter histories is one subsystem with its unique data sets. The ballots cast by voters and the tabulation process’s data, subtotals, and totals are a different subsystem.
The current generation of voting machines are built around casting paper ballots. While most ballots are hand- or machine-marked, the voting systems now in use in Arizona and across the U.S. almost entirely use computer software to detect and compile votes.
Ballot images are a photo-like screenshot of every paper ballot card that is automatically created by scanners at the start of the counting process. Once set up, software can sift through ballot images in minutes, unlike other post-election reviews that can take days or longer. Ballot images, like signature files, are visual, which is more easily understood than numeric data.
One of the ironies about election disinformation – or false claims that seek to discredit the process, administrators, and unpopular results – is that it has arisen as states have updated their voting infrastructure with the most data-rich, evidence-producing computers in history. Most voters do not realize that by 2020, they were voting on devices that track almost every step of the process. Russian hacking in 2016 led to a national updating of these systems.
Most voters also do not realize that humans do not count most of their ballots. The paper ballot is the primary voting record. It is the most direct evidence of a voter’s intent, whether marked by hand or a printer. But the counting begins when the paper is scanned and a digital image – a screenshot – is automatically made of each side of every ballot card.
Here’s what happens. A scanner copies the paper ballot. Software then imposes a grid on the ballot image to correlate the marked ovals with that precinct’s candidates and questions. That is how votes are detected. The votes are then assigned and compiled into a database that is a giant spreadsheet. Each ballot becomes a line in that large chart, called the cast vote record. Every choice before voters becomes a column. Each ballot’s votes are noted and added up.
Like bricks in a pyramid, precinct-level results are compiled. They are imported into a master cast vote record database. This process is automated with one big exception; sloppily marked ballots. In that case, the most modern voting systems flag the questionable decisions on that ballot and put a digital image of that ballot into a cue for review by an election worker. That review, which the worker determines voter intent, is usually done at a county government’s headquarters and is watched by political party representatives. That process is known as adjudication.
The workers do not see the paper ballot. They see a screenshot image of a scanned ballot card on their computer terminals. They look for patterns – such as a person who circled all of their ballot’s ovals or made an “X” by mistake. If the voter’s intent is clear, the worker assigns that vote to the intended choice. That decision is noted in the image file and results spreadsheet.
Part II: A Closer Look
Here is what this technology looks like for election workers. This screenshot below is from a brochure from Dominion Voting Systems that shows its “ballot audit review” module. To the left is the individual ballot’s serial number. In the center is a visual representation of its votes as recorded in the cast vote record (as opposed to the numeric spreadsheet). To the right is the digital image of the ballot in question. This screenshot is one version of what workers see and use. It is what observers inside election offices can see. It begins to show how today’s voting systems can present more easily understood visual evidence of ballots, votes, and results.

(Source: https://www.dominionvoting.com/optional-solutions/)
There are other ballot image systems that are designed to double check the accuracy of the official voting system. A San Diego-based non-profit, Citizens Oversight, has been developing a system, Audit Engine, that it hopes non-government organizations will use. It has been piloted in California, Wisconsin, Florida, and Georgia. Here is a screenshot of an unusually sloppy ballot that Audit Engine noted in its report on the 2020 election in Bartow County, Georgia.
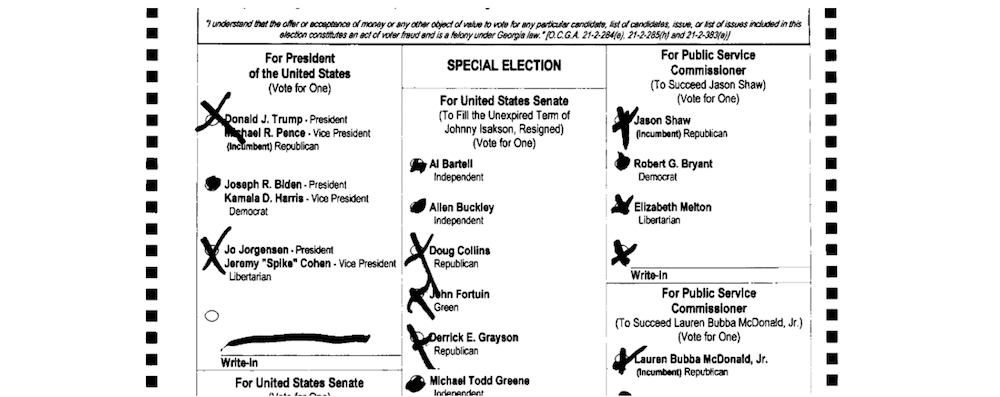
(Source: https://copswiki.org/w/pub/Common/M1986/GA%20Bartow%2020201103%20Narrative%20Report.pdf)
In Volusia County, Florida, progressives allied with AUDIT Elections USA used this system to assess 2020’s results. While it found a few vote-counting errors, it proved that the election’s overall results were correct. Volusia County Supervisor of Elections Lisa Lewis said that she did not know a ballot image audit was being done after she fulfilled the records request. But Lewis was glad to show the resulting analysis to Trump supporters after 2020.
“We were able to tell people, ‘Look, we didn’t do an audit. It was an independent auditor. And the results are the results,” Lewis said. “There are always going to be people who are skeptical about the election… But it does relieve a lot of people’s mindsets. The ballot speaks for itself.”
A for-profit Boston firm, Clear Ballot, has developed the most advanced ballot image system. It was piloted in Florida during the past dozen years and is federally certified.
The Maryland State Board of Elections has been using it since 2016 to independently recount the ballot images created by their counties’ primary system (from Election Systems & Software) before the winners are certified. In 2018, the board made a presentation before the National Association of State Election Directors that discussed why image audits were uniquely helpful with finding and fixing operational mistakes, such as two ballots being pulled through a scanner at the same time, or a fold on a ballot card being misread as a line of ink.
Nikki Charlson, a senior staffer, said the board also has shared ballot images with disappointed candidates. “It gives them an idea of what the likely outcome of that recount will be,” she said. The board also puts images online, which has deflected some criticism by election skeptics.
In Florida and in a handful of other states, Clear Ballot is used slightly differently. Instead of analyzing the primary voting system’s images, every ballot is rescanned by a separate computer system. As in Maryland, the software finds, sorts, ranks, and presents cropped images of the neatest marked ovals to the sloppiest ovals as it compiles its tally. Viewers can select any oval and zoom in to look at that section of the ballot card. If needed, officials can retrieve the paper ballot in question because it has been stored in the order that it was scanned.
Here is what election workers and observers see as this software ranks the sloppiest ovals. Note how the hand-shaped cursor has enlarged the portion of the ballot that contains the messy oval and other choices in that contest.
(Source: https://vimeo.com/757284892?fbclid=IwAR1hl05oMtqDp08pjP-4sVI8QdiNrEMvyLH0-21nAmpWl1Q1H8j8R2gZTgk)
In Florida, where this technology was piloted a dozen years ago, Clear Ballot’s founder Moore said the technology has found mistakes that prevented the wrong winners from being certified in a handful of Florida counties. It discovered ballots that had not been counted in a sheriff’s race in Putnam County that reversed the results. In St. Lucie County, the election supervisor used the audit as a pre-emptive tool after a Tea Party Republican congressman lost and started attacking the election. (Alan West moved to Texas and became state GOP chair.)
Mark Earley, the elected supervisor of elections in Leon County (where Tallahassee, Florida’s capital is located), is president of the Florida State Association of Election Supervisors and a Democrat. A decade ago, he used an early version of the system to show candidates running for an unpaid local office that it was not worthwhile to do a recount. The preliminary results showed the leading candidate was ahead by less than 200 votes.
“We brought the candidates in – and we were using a pilot version of the software – and said, ‘Look, we can do a massive recount. But we’re going to have to literally look at 49,000 pieces of paper by hand after we find them all [by sifting through all of the county’s ballots], which is going to take forever,” he recalled. “We were able to zero in and focus on those ballots that had no marks [votes for either candidate], and they could glance through them.”
In 2018, when every Florida county had to conduct three simultaneous statewide recounts – including for governor and U.S. senator – as well as conduct local recounts, Leon County had been routinely using Clear Ballot’s audit system to double check its results. But Florida’s recount law at the time required that counties do a mix of machine and hand counts. Before that process began, Earley showed the system to campaign representatives from four races being recounted.
“I went through this four times that day and said, ‘After we go through this [official process] for an entire week, here’s what you are going to see. And it was almost exactly dead on,” he said.
The campaign lawyers were impressed for other reasons. These partisan advocates do not just observe at recounts. They look for questionable ballots that could tip the results their way.
“They were thrilled to be able to see it so transparently and from a different system,” he said. “The fact that you could search through all of these images so quickly and find where there were no votes, or over votes [more than one vote in a contest], or where voter intent maybe was misinterpreted by a machine… And if there is [a mistake], it’s right there. It’s apparent. Nobody’s hiding anything. It’s just right there. It’s real time. It’s so easy to understand.”
Florida subsequently passed a law to use ballot images in recounts. But bureaucratic infighting over the fact there is only one certified vendor, Clear Ballot, has prevented its implementation. In January 2023, Secretary of State Cord Byrd, a Republican, told a state senate committee that he wanted all 67 counties to be using this technology as soon as possible.
These players – election officials, legislators, analysts, activists, and technologists from Florida, Maryland, Arizona, California, and other states – are all saying that skeptical voters need to be given a way to draw their own conclusions about election results.
“People need something they can put their hands on,” Earley said, referring to the doubters who have come into his office after Election Day.
Part III: Impact on Disinformation
Of course, making essential election records accessible to the public does not guarantee that doubters will be satisfied. Digital ballot images and the cast vote record database are large files that can be are hard for the public to parse. Microsoft Excel cannot be used to search through a cast vote record database, for example. Some officials are also wary of how these records might be used outside of their control.
There has been state-based litigation and is likely to be more litigation over what election data must be saved and made public. Very few non-profits and academics are developing image audit technology. But election officials that have posted ballot images online (by creating public portals based on their vendor’s technologies) and made cast vote records available say that these actions have lessened the factors and atmosphere that encourage disinformation.
“We post the images on our website which removes the need for people to come to our office to review them. I think, in close elections, having the images posted online reduces the interest in requesting recounts,” said John Arntz, who has been San Francisco’s election director since 2002. “The reason is candidates and campaigns can view and tally the votes themselves without incurring the expenses associated with recounts.”
Most voters seem to be satisfied with these steps, Arntz said, even after harsh campaigns.
“My sense is most voters don’t seek additional information after election results are posted, including for contests with close final tallies,” he said. “Campaigns seem more interested in having the images posted. Some advocates dislike the posting of the images, indicating this removes voter confidentiality. But such views have not been substantiated.”
As Lisa Lewis, election supervisor for Volusia County, Florida, said, “It does relieve a lot of people’s mindsets. The ballot speaks for itself.”